
NoTap! Visual Sociology and Online Protest

The story so far...📖
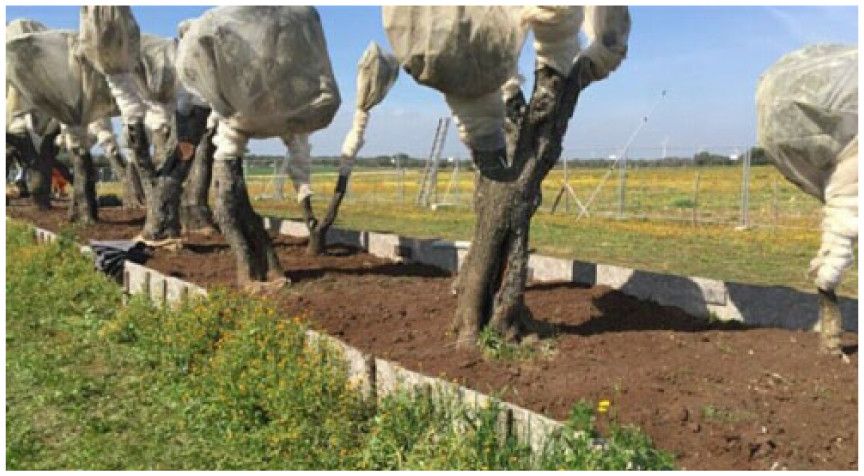
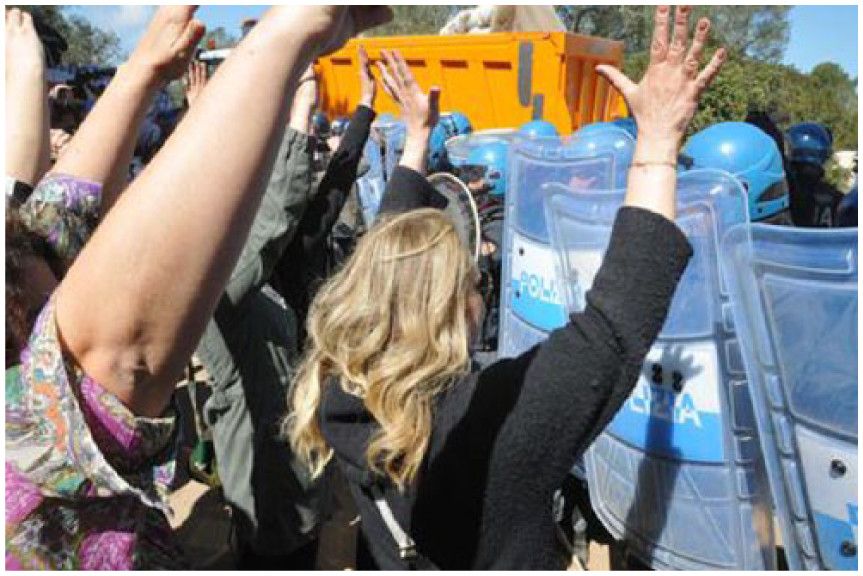
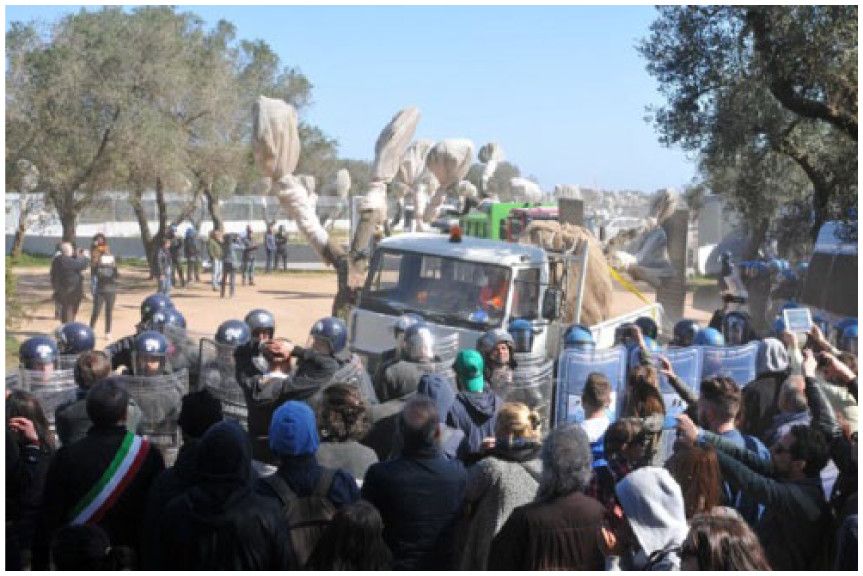
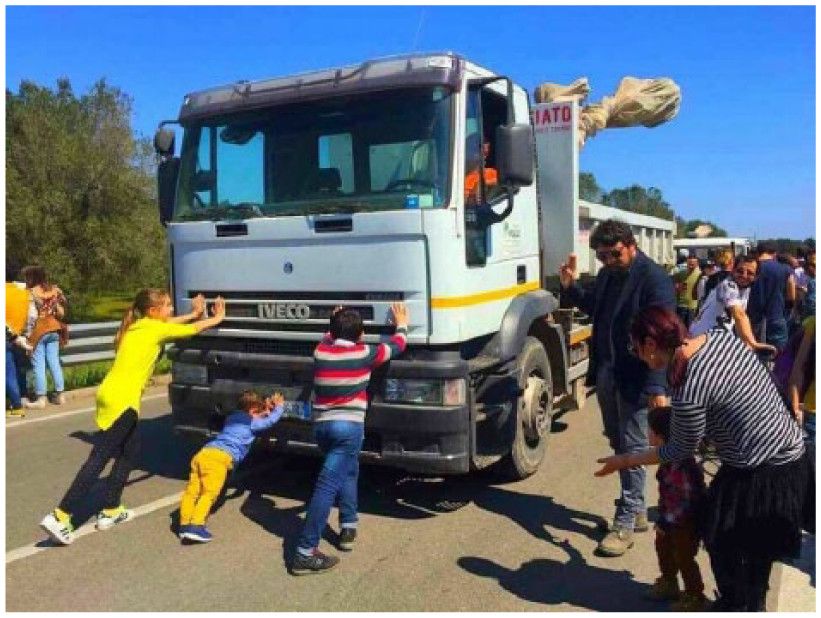
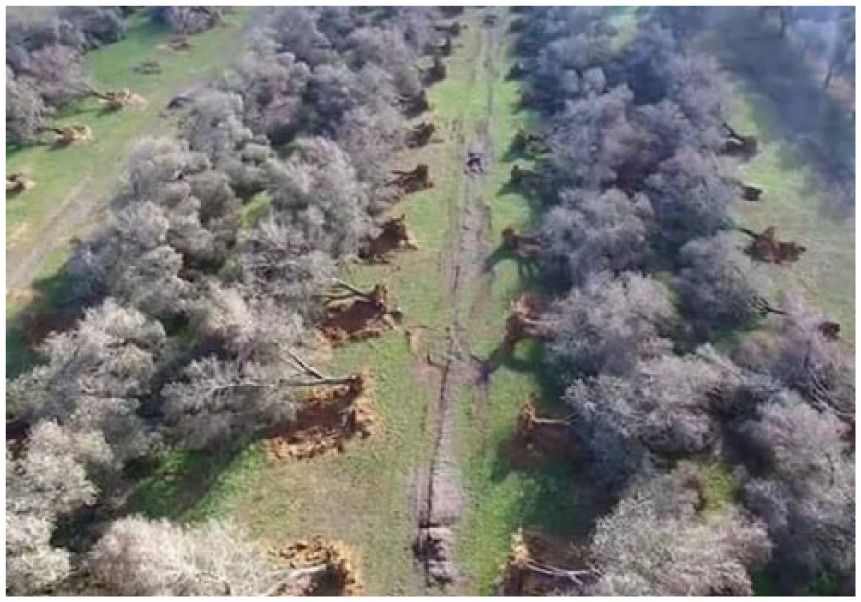
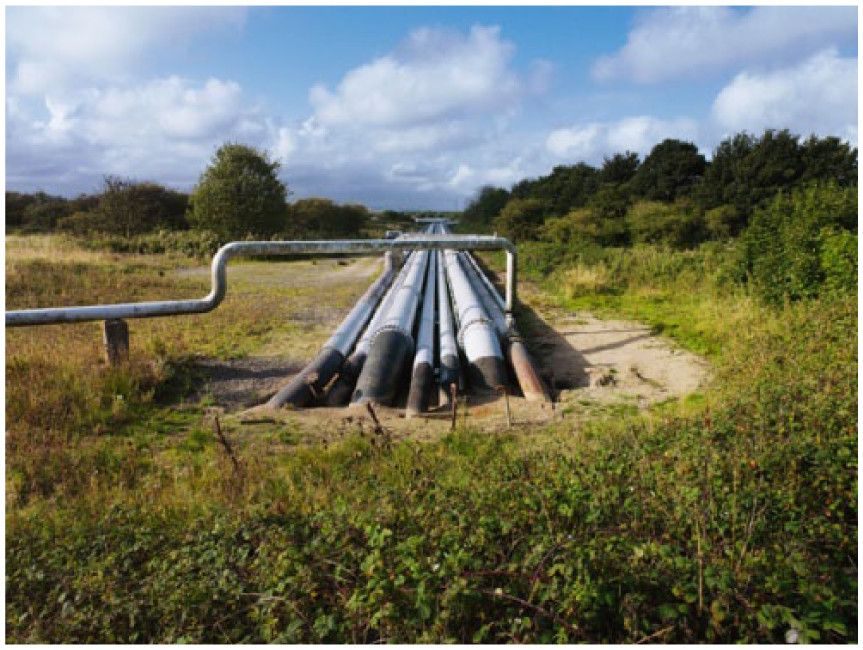
One of my earliest Computational Social Science collaborations began when my colleague, Dr. Anna Di Ronco dropped in on me because she wanted to gather tweets related to an emerging protest movement in Italy. The movement, NoTap, was developing in response to plans for a Trans-Adriatic Pipeline that would bring gas from Azerbaijan into the EU through Italy. Anna had noticed that there was a significant amount of activity both online and off, and that the online activity in particular appeared to be discussing issues and topics that weren't making it to the mainstream newspapers in the region. Her interest piqued, she asked if I knew an easy way to collect tweets. I don't think she entirely expected what happened next.
Twitter as an Activist Space ✊
The project has been ongoing since 2017 and since then we've done quite a lot. Our key approach so far has been to focus on the visuals of protest and the ways in which images as well as text were deployed to re-frame the story by activist groups. My role as chief code-monkey 🐵 was to gather around 3K tweets that used #notap and other related hashtags, and process them into a format that made Anna's job as qualitative analyst easier, as well as provide stats on tweet popularity etc.
In terms of computational social science the job was relatively low complexity, but it got the job done. Anna was able to work with a much larger dataset than she'd ever have planned to using traditional techniques, and I made many mistakes which is a far superior way to learn something than getting it right the first time.
We wrote up that part of the project and published in Crime, Media Culture, and you can read a free open access version of the paper too.
Visual Sociology: Rub liberally with AI 🖥
Having conquered the basics of Twitter data collection we decided to move on to the obvious next step - using a complex AI trained on billions of images to help us do visual sociological work 👍.
To extend the project we'd been collecting more and more tweets around #NoTap, and Anna began planning to visit the activists in person. During a departmental outing I talked Anna's ear off about the fact that our database had hit around 20K tweets, and that we probably needed to rethink how to handle the thousands of associated images that came with them. The goal again was to provide some computational assistance to the qualitative work, but this time we needed to think bigger. The tentative solution was to rub the images with AI and see what happened.
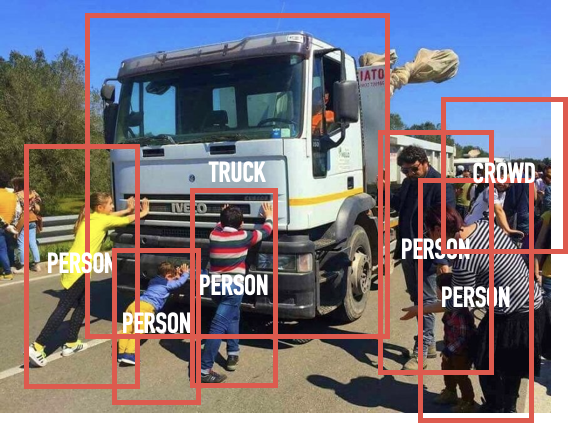
The more concrete proposal was to use 'Object Detection', a technique used within computer vision that allows computers to recognise objects from visual data such as photos and video. If we could first get the computer to tag the images with relevant keywords before analysis, we could use that information to better manage the dataset. What emerged was that the tagging formed the basis of a technique used to develop an essentially descriptive, but useful thematic analysis of the images. That analysis could then be used as the foundation for a more nuanced, more human, qualitative analysis.
Discovering Visual Themes using Computational Magic ✨
Turns out the easiest part of the process was the actual tagging. Google, in the process of hoovering up everyone's images from around the world, has produced a pretty robust object detection system which they make available to us mortals via their API, Google Vision. The tricky part is the nature of images on Twitter. You get a lot of image duplication on Twitter, which is much the point of social media. However for our purposes, we wanted to de-duplicate, at least at first and so this was the major hurdle to tackle. Exactly how we did that is a bigger topic which I'll write about another day so, for now, just presume we did it with elegance and gusto.
Google Vision provides each image with a series of tags based on what it thinks it sees, each with a confidence score indicating how confident the model is that what it's tagged is correct. I like to imagine the AI humming and hawing, or perhaps needing a pat on the back and an occasional "you got this!" to keep its spirits up. Having produced the tags, a simple starting point was a basic frequency account of tags to get a sense of what was in the images overall. However the real value was for thematic analysis.
To a computer, the tags assigned to an image, and the level of confidence the AI had about each tag can act as valuable information to help it partition those images into different groups. It can use those values to work out that image 1 and image 2 are more similar to one another, and that image 3 and image 4 have different kinds of tags so they're dissimilar. The result is that we can in an abstract way, come up with a representation of these images that is able to place each image at an appropriate distance from every other image, such that similar ones are closer and dissimilar are further away. We can then also use that representation to determine whether we think it is reasonable to cluster those images into different descriptive themes.
These descriptive themes, first determined computationally, can then be of great help to a qualitative analyst (i.e. Dr. Anna) as they know the extent to which different topics are visually represented within the corpus. However explaining exactly why those topics are the most prevalent is still down to human interpretation.
The results of all of this, including what the actual image categories are and why, alongside Anna's ethnographic work on-the-ground with the protestors is currently under review with Crime, Media, Culture.